Focus Fonds

Carmignac Patrimoine: the Fund Manager’s thought
Carmignac Patrimoine A EUR share class posted +4.8% vs +0.9% for the reference indicator 1 and -2.9% for its Morningstar category 2.
The handling of the Covid-19 pandemic triggered a substantial shock to growth. After contracting in the second quarter, the global economy recovered in the third – thanks to life support for consumer spending.
Indeed, the speed, scope and form of the authorities’ response to the emergency were truly unprecedented. Central banks and governments took concerted action to ensure that enough money would continue to flow to economic agents – businesses and households – to keep them going and to regulate the debt financing of economic activity via the financial markets and banking system. However, the rally in financial assets currently under way is highly dependent on monetary and fiscal support flies in the face of what are still patchy economic fundamentals and a most uncertain outlook.
Our experience in managing previous market crises was useful. This time again, like in 2000, in 2008 and 2011, the first imperative was to rapidly take the full measure of the risk, and act on it. The globalization of the epidemic was a clear possibility in our mind. However, our judgement was that, whereas healthcare systems in Europe and the US were certainly not prepared for the pandemic, policy makers were prepared to deal with a market crisis.
-
Our highly flexible asset allocation gave us the agility we needed to get through the period.
-
Indeed, a solid portfolio construction and good risk management during the crisis allowed us to re-expose the Fund to take advantage of market dislocation and profit from the rebound that followed.
- On the equity front, our allocation bias for secular growth stocks were the largest contributors to performance, thanks to both their resilience in down markets and sharp rebound in the aftermath. The former can be attributed to their low correlation to economic activity while the latter notably stems for the flight to growth that took place. Indeed, the crisis we are experiencing has accelerated several major underlying trends including digitization and ecommerce. Finally, the combination of loose monetary and fiscal policies led us to build up a position in goldmines to hedge against a risk of higher inflation expectations, that turned out to be very profitable.
- On the fixed income front, we limited losses in the drawdown by quickly cutting our exposure to peripheral bonds and Emerging market debt while increasing our cash holdings. Furthermore, the third quarter brought back happy days to corporate credit in the form of rising yields and capital gains made possible by narrowing interest-rate differentials. We believe this segment still offers a great deal of value.
Carmignac Patrimoine - A Balanced Portfolio
The portfolio composition may change anytime
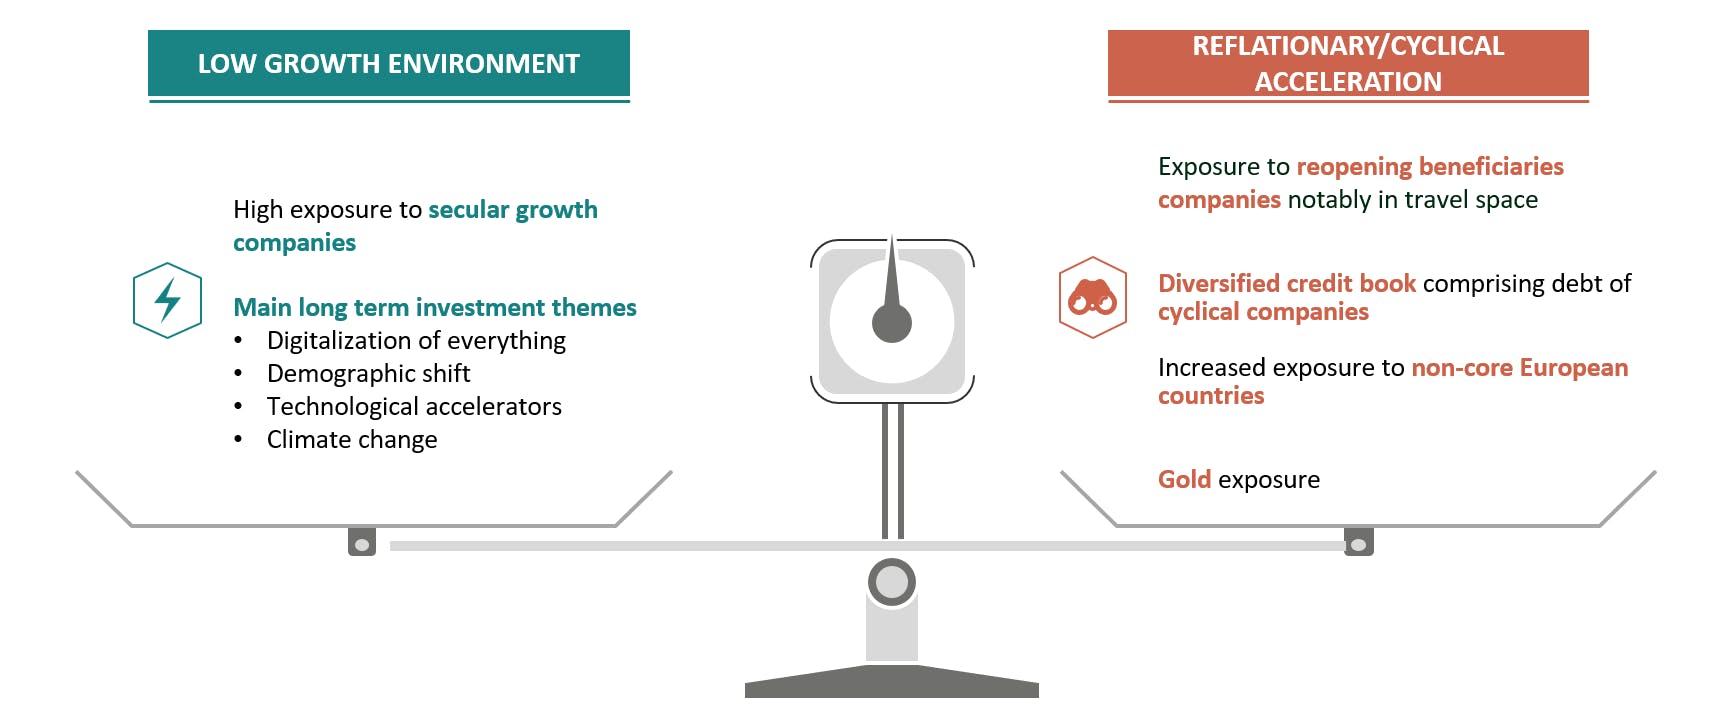
Two scenarios are basically shaping up. On one hand, the shutdown of activities and slow reopening has made the economy more sluggish than ever; on the other, both Central banks and governments are providing an unprecedented support, while a vaccine could be found in the coming months, opening the door for higher inflation expectations and positive economic surprises.
We are therefore keeping on one side our focus on secular growth companies, albeit we’ve taken profit on some of our biggest contributors. Slow growth means it is becoming increasingly hard for companies to become or stay profitable, not to mention the shock many of them have suffered from with the economic pause. Conversely, secular growers -companies that perform regardless of the overall health of the economy- are seeing increased interest from investors. Also, Central banks’ loose policies are intended to keep rates low for longer, which could sustain current valuation. A lot of them can be found in the technology sector or in healthcare, an ever-evolving industry. Finally, we have selectively signed up to some IPOs, which had the busiest quarter since 2000 in volume terms.
On the other side, we have adjusted the portfolio to take into account this liquidity-driven environment and positive news flow that could benefit cyclical assets. We are notably playing this thematic via the travel industry, that has suffered a lot from the crisis but benefit from reopening economies. We nevertheless optimize such exposure across the capital structure as such companies are not necessarily attractive in terms of both equity and debt. For example, Airline companies are asset heavy and leveraged, denting on their current and future profitability, and making them unattractive for equity investors. However, their high tangible assets (namely planes) act as collaterals for the cash they are raising, making them attractive for creditors.
As a hedge against a rise in inflation expectations, we hold exposure to goldmines. We are also maintaining our exposure to non-core sovereign debt, supported by coordinated action of governments in the region. We have nevertheless taken profit on our Italian debt as regional elections are coming up.
Carmignac Patrimoine A EUR Acc
| 2014 | 2015 | 2016 | 2017 | 2018 | 2019 | 2020 | 2021 | 2022 | 2023 |
2024 (YTD) ? Depuis le début de l'année |
|
|---|---|---|---|---|---|---|---|---|---|---|---|
| Carmignac Patrimoine A EUR Acc | +8.81 % | +0.72 % | +3.88 % | +0.09 % | -11.29 % | +10.55 % | +12.40 % | -0.88 % | -9.38 % | +2.20 % | +5.51 % |
| Indicateur de référence | +15.97 % | +8.35 % | +8.05 % | +1.47 % | -0.07 % | +18.18 % | +5.18 % | +13.34 % | -10.26 % | +7.73 % | +4.13 % |
Défilez à droite pour voir le tableau dans sa totalité
| 3 ans | 5 ans | 10 ans | |
|---|---|---|---|
| Carmignac Patrimoine A EUR Acc | -1.44 % | +2.92 % | +2.06 % |
| Indicateur de référence | +3.32 % | +5.42 % | +6.72 % |
Défilez à droite pour voir le tableau dans sa totalité
Source : Carmignac au 28/03/2024
| Coûts d'entrée : | 4,00% du montant que vous payez au moment de votre investissement. Il s'agit du maximum que vous serez amené à payer. Carmignac Gestion ne facture pas de frais d'entrée. La personne en charge de la vente du produit vous informera des frais réels. |
| Coûts de sortie : | Nous ne facturons pas de frais de sortie pour ce produit. |
| Frais de gestion et autres frais administratifs et d’exploitation : | 1,51% de la valeur de votre investissement par an. Cette estimation se base sur les coûts réels au cours de l'année dernière. |
| Commissions liées aux résultats : | 20,00% max. de la surperformance dès lors que la performance depuis le début de l'exercice est positive, dépasse la performance de l'indicateur de référence et si aucune sous-performance passée ne doit encore être compensée. Le montant réel variera en fonction de la performance de votre investissement. L'estimation des coûts agrégés ci-dessus inclut la moyenne des 5 dernières années, ou depuis la création du produit si celui-ci a moins de 5 ans. |
| Coûts de transaction : | 0,63% de la valeur de votre investissement par an. Il s'agit d'une estimation des coûts encourus lorsque nous achetons et vendons les investissements sous-jacents au produit. Le montant réel varie en fonction de la quantité que nous achetons et vendons. |
1 Reference indicator: 50% MSCI AC World NR (USD) (net dividends reinvested), 50% Citigroup WGBI All Maturities (EUR). Quarterly rebalanced.
2 Morningstar Category: EUR Moderate Allocation - Global. Source: Carmignac, 30/09/2020. Annualized performance as of 30/09/2020. Performance of the A EUR acc share class. Past performance is not necessarily indicative of future performance. The return may increase or decrease as a result of currency fluctuations, for the shares which are not currency-hedged. Performances are net of fees (excluding possible entrance fees charged by the distributor). © 2020 Morningstar, Inc. All Rights Reserved. The information contained herein: is proprietary to Morningstar and/or its content providers; may not be copied or distributed; and is not warranted to be accurate, complete or timely. Neither Morningstar nor its content providers are responsible for any damages or losses arising from any use of this information. From 01/01/2013 the equity index reference indicators are calculated net dividends reinvested.
A EUR Acc share class ISIN code: FR0010135103. Risk Scale from the KIID (Key Investor Information Document). Risk 1 does not mean a risk-free investment. This indicator may change over time. The reference to a ranking or prize, is no guarantee of the future results of the UCIS or the manager.
Carmignac Patrimoine E EUR Acc
Durée minimum de placement recommandée
Risque plus faible Risque plus élevé
ACTION: Les variations du prix des actions dont l'amplitude dépend de facteurs économiques externes, du volume de titres échangés et du niveau de capitalisation de la société peuvent impacter la performance du Fonds.
TAUX D’INTÉRÊT: Le risque de taux se traduit par une baisse de la valeur liquidative en cas de mouvement des taux d'intérêt.
CRÉDIT: Le risque de crédit correspond au risque que l’émetteur ne puisse pas faire face à ses engagements.
RISQUE DE CHANGE: Le risque de change est lié à l’exposition, via les investissements directs ou l'utilisation d'instruments financiers à terme, à une devise autre que celle de valorisation du Fonds.
Le Fonds présente un risque de perte en capital.