Quarterly Report

Carmignac P. EM Debt: Letter from the Fund Manager
-
+10.06%Carmignac P. EM Debt’s performance
in the 1st quarter of 2023 for the FW EUR Share class
-
+3.30%Reference indicator’s performance
in the 1st quarter of 2023 for JP Morgan GBI – Emerging Markets Global Diversified Composite Unhedged EUR Index
-
+10.49%3-year annualized performance
versus +1.21% for the reference indicator over the period
Carmignac P. EM Debt gained +10.06% in the first quarter of 2023, while its reference indicator1 was up +3.30%.
Market environment
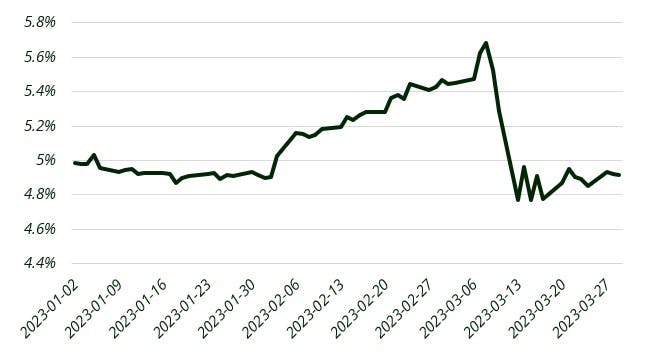
During the first quarter of 2023 we have continued to see high levels of volatility across markets. While we saw the market pricing the end of rate hikes in the US in January the NFP (Non-Farm Payrolls) data published on the 3rd of February repriced the hikes until we started to see bank stress in the US and Europe.
US Terminal Rate

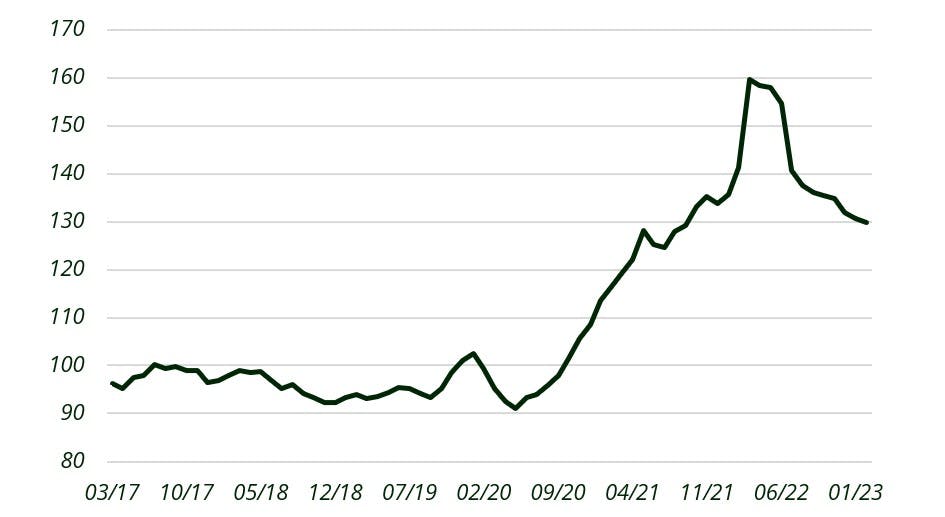
In this environment the EM sovereign credits performed well in January and remained stable in February, but the sharp rally in rates of March did not translate to a rally in the credit, especially the high yield (HY). The Local rates have been the best behaved in the EM universe in this period of volatility. Latam rates continued to remain stable despite higher rates in the US while the CE3 region enjoyed a strong rally over the quarter. Indeed, in EM inflation pressures have started to ease during 2022 thanks to the restrictive actions taken early by central banks. Importantly we have also seen towards the end of the quarter the drop in Global food prices which translates to some domestic food inflation.
Global Food Prices Index

Sources: Carmignac, Bloomberg, 31/03/2023
In the FX space, EM currencies performed well for most of the month versus the USD and EUR, with a significant amount of volatility around the sharp repricing of rates in February as a number of heavily positioned currencies got liquidated.
Performance review
In this context from its positioning the fund was able to make most of its returns from the EM Local Rates as well as the FX. In particular the fund maintained an exposure to CE3 Rates with the Czech Republic and Hungary, which saw significant rallies during the period (January and March). In other regions Korean Rates benefitted from the rally in March. For the Latam region we benefitted from the Brazilian rates, but for the MXN Banxico caught the market by surprise with a 50bps hike impacting the fund performance.
The FX was the second source of performance largely thanks to positions in Latam, a region with some of the highest real rates in the world and in particular for BRL, CLP and MXN. EMEA was the second region of performance with the HUF continuing its stabilization vs the EUR and CZK rallying from the central bank’s policy and improving external balances.
Outlook for the next months
Going forward we think that given the stress that we have seen on the financial system it is unlikely that we can continue to reprice the terminal rates higher. Furthermore, we expect that the impact of the tightening that we have seen is starting to impact economies, with property prices correcting in a number of countries, financial system stress, etc…
In this context we think that EM local rates are going to continue to play an important role in the fund, in particular rates in Brazil should be able to price further cuts as the new fiscal framework is published and the political noise drops. Also, Mexican rates are interesting as a proxy to US rates but starting from a tighter stance and a slower economy. Finally, in CE3 we continue to like Czech rates as well as Hungarian rates.
In FX, while we like to be invested in high carry currencies such as the CZK or the BRL, we are going to remain flexible in the currency allocation. In particular if we start seeing rate cuts sooner than expected, EM FX will be under pressure vs the USD or the EUR. Regarding our exposure to External debt and given the lack of correction in the global risk despite the increased stress we remain cautious and focused on idiosyncratic stories while maintaining a relatively high level of protection via CDS.
Sources: Carmignac, Bloomberg, 31/03/2023
Carmignac Portfolio EM Debt FW EUR Acc
Recommended minimum investment horizon
Lower risk Higher risk
EMERGING MARKETS: Operating conditions and supervision in "emerging" markets may deviate from the standards prevailing on the large international exchanges and have an impact on prices of listed instruments in which the Fund may invest.
INTEREST RATE: Interest rate risk results in a decline in the net asset value in the event of changes in interest rates.
CURRENCY: Currency risk is linked to exposure to a currency other than the Fund’s valuation currency, either through direct investment or the use of forward financial instruments.
CREDIT: Credit risk is the risk that the issuer may default.
The Fund presents a risk of loss of capital.
Carmignac Portfolio EM Debt FW EUR Acc
| 2014 | 2015 | 2016 | 2017 | 2018 | 2019 | 2020 | 2021 | 2022 | 2023 |
2024 (YTD) ? Year to date |
|
|---|---|---|---|---|---|---|---|---|---|---|---|
| Carmignac Portfolio EM Debt FW EUR Acc | - | - | - | +1.10 % | -9.97 % | +28.88 % | +10.54 % | +3.93 % | -9.05 % | +15.26 % | +0.37 % |
| Reference Indicator | - | - | - | +0.42 % | -1.48 % | +15.56 % | -5.79 % | -1.82 % | -5.90 % | +8.89 % | +0.38 % |
Scroll right to see full table
| 3 Years | 5 Years | 10 Years | |
|---|---|---|---|
| Carmignac Portfolio EM Debt FW EUR Acc | +1.23 % | +6.93 % | - |
| Reference Indicator | +0.43 % | +0.15 % | - |
Scroll right to see full table
Source: Carmignac at 28/06/2024
| Entry costs : | We do not charge an entry fee. |
| Exit costs : | We do not charge an exit fee for this product. |
| Management fees and other administrative or operating costs : | 1,05% of the value of your investment per year. This estimate is based on actual costs over the past year. |
| Performance fees : | There is no performance fee for this product. |
| Transaction Cost : | 0,57% of the value of your investment per year. This is an estimate of the costs incurred when we buy and sell the investments underlying the product. The actual amount varies depending on the quantity we buy and sell. |